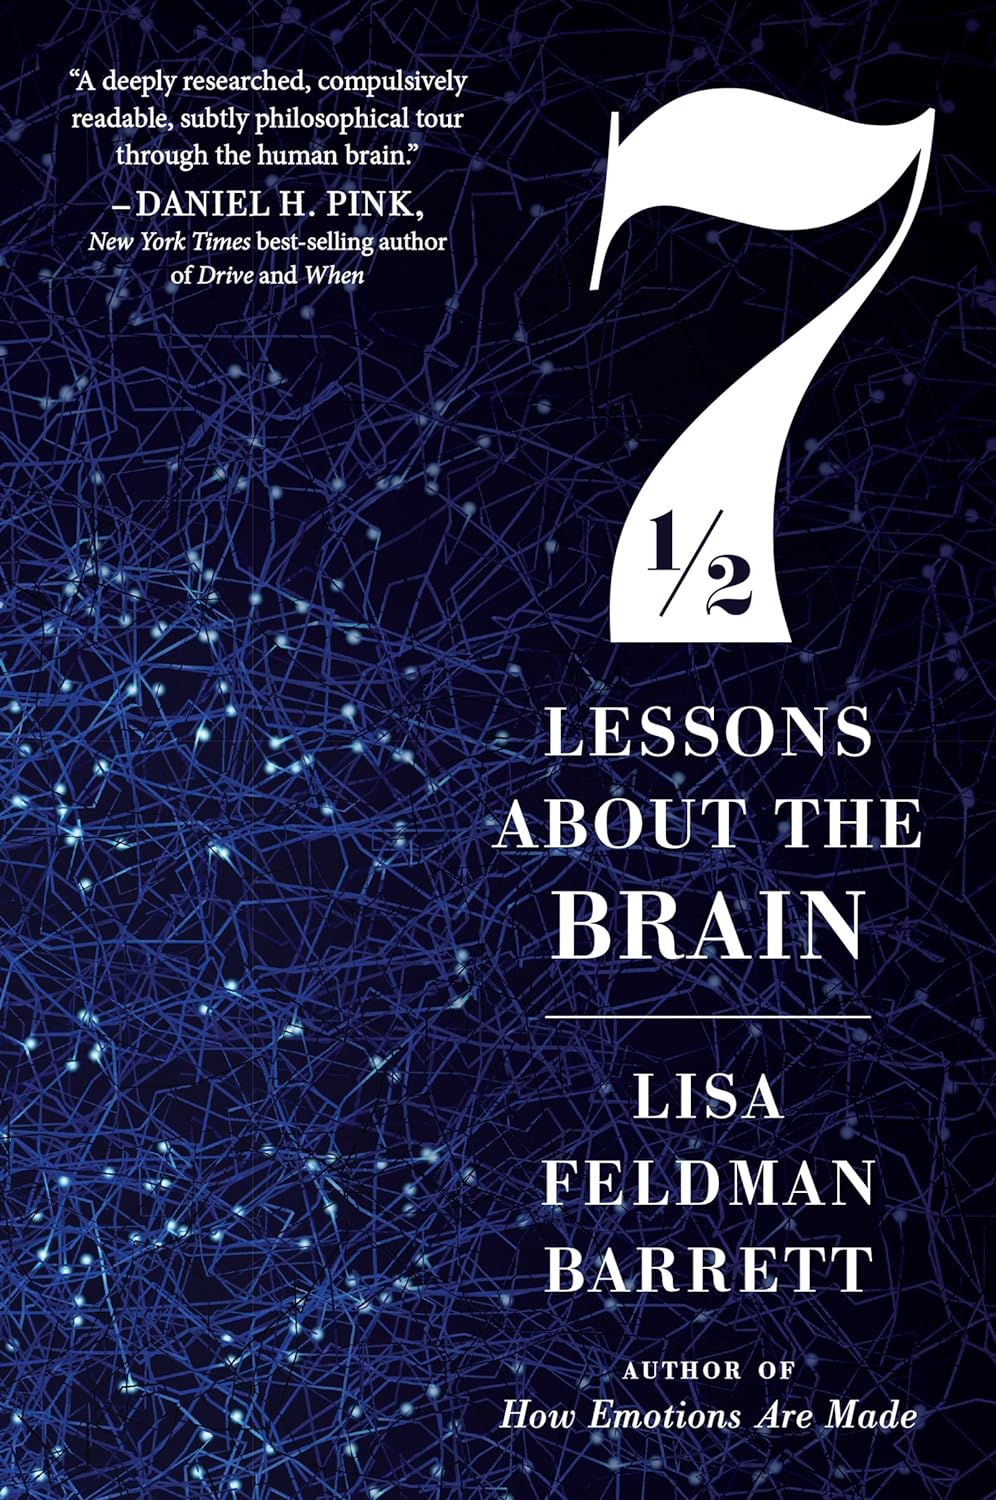
Seven and a Half Lessons About the Brain – by Dr. Lisa Feldman Barrett
10almonds is reader-supported. We may, at no cost to you, receive a portion of sales if you purchase a product through a link in this article.
We’ve reviewed books about neurology before, and we always try to review books that bring something new/different. So, what makes this one stand out?
Dr. Lisa Feldman Barrett, one of the world’s foremost neuroscientists, starts with an overview of how our unusual brain (definitely our species’ defining characteristic) came to be, and then devotes the rest of the book to mostly practical information.
She explains, in clear terms and without undue jargon, how the brain goes about such things as making constant predictions and useful assumptions about our environment, and reports these things to us as facts—which process is usually useful, and sometimes counterproductive.
We learn about how the apparently mystical trait of empathy works, in real flesh-and-blood terms, and why some kinds of empathy are more metabolically costly than others, and what that means for us all.
Unlike many such books, this one also looks at what is going on in the case of “different minds” that operate very dissimilarly to our own, and how this neurodiversity is important for our species.
Critically, she also looks at what else makes our brains stand out, the symphony of “5 Cs” that aren’t often found to the same extent all in the same species: creativity, communication, copying, cooperation, and compression. This latter being less obvious, but perhaps the most important; Dr. Feldman Barrett explains how we use this ability to layer summaries of our memories, perceptions, and assumptions, to allow us to think in abstractions—something that powers much of what we do that separates us from other animals.
Bottom line: if you’d like to learn more about that big wet organ between your ears, what it does for you, and how it goes about doing it, then this book gives a very practical foundation from which to build.
Click here to check out Seven and a Half Lessons about the Brain, and learn more about yours!
Don’t Forget…
Did you arrive here from our newsletter? Don’t forget to return to the email to continue learning!
Recommended
Learn to Age Gracefully
Join the 98k+ American women taking control of their health & aging with our 100% free (and fun!) daily emails:
-
‘Active recovery’ after exercise is supposed to improve performance – but does it really work?
10almonds is reader-supported. We may, at no cost to you, receive a portion of sales if you purchase a product through a link in this article.
Imagine you have just finished a workout. Your legs are like jelly, your lungs are burning and you just want to collapse on the couch.
But instead, you pick yourself up and go for a brisk walk.
While this might seem counterintuitive, doing some light activity after an intense workout – known as “active recovery” – has been suggested to reduce soreness and speed up recovery after exercise.
But does it work or is it just another fitness myth?
gpointstudio/Shutterstock What is active recovery?
Active recovery simply describes doing some low-intensity physical activity after a strenuous bout of exercise.
This is commonly achieved through low-intensity cardio, such as walking or cycling, but can also consist of low-intensity stretching, or even bodyweight exercises such as squats and lunges.
The key thing is making sure the intensity is light or moderate, without moving into the “vigorous” range.
As a general rule, if you can maintain a conversation while you’re exercising, you are working at a light-to-moderate intensity.
Some people consider doing an easy training session on their “rest days” as a form of active recovery. However, this has not really been researched. So we will be focusing on the more traditional form of active recovery in this article, where it is performed straight after exercise.
What does active recovery do?
Active recovery helps speed up the removal of waste products, such as lactate and hydrogen, after exercise. These waste products are moved from the muscles into the blood, before being broken down and used for energy, or simply excreted.
This is thought to be one of the ways it promotes recovery.
In some instances active recovery has been shown to reduce muscle soreness in the days following exercise. This may lead to a faster return to peak performance in some physical capabilities such as jump height.
Active recovery can involve stretching. fatir29/Shutterstock But, active recovery does not appear to reduce post-exercise inflammation. While this may sound like a bad thing, it’s not.
Post-exercise inflammation can promote increases in strength and fitness after exercise. And so when it’s reduced (say, by using ice baths after exercise) this can lead to smaller training improvements than would be seen otherwise.
This means active recovery can be used regularly after exercise without the risk of affecting the benefits of the main exercise session.
There’s evidence to the contrary too
Not all research on active recovery is positive.
Several studies indicate it’s no better than simply lying on the couch when it comes to reducing muscle soreness and improving performance after exercise.
In fact, there’s more research suggesting active recovery doesn’t have an effect than research showing it does have an effect.
While there could be several reasons for this, two stand out.
First, the way in which active recovery is applied in the research varies as lot. It’s likely there is a sweet spot in terms of how long active recovery should last to maximise its benefits (more on this later).
Second, it’s likely the benefits of active recovery are trivial to small. As such, they won’t always be considered “significant” in the scientific literature, despite offering potentially meaningful benefits at an individual level. In sport science, studies often have small sample sizes, which can make it hard to see small effects.
But there doesn’t seem to be any research suggesting active recovery is less effective than doing nothing, so at worst it certainly won’t cause any harm.
When is active recovery useful?
Active recovery appears useful if you need to perform multiple bouts of exercise within a short time frame. For example, if you were in a tournament and had 10–20 minutes between games, then a quick active recovery would be better than doing nothing.
Active recovery might also be a useful strategy if you have to perform exercise again within 24 hours after intense activity.
For example, if you are someone who plays sport and you need to play games on back-to-back days, doing some low-intensity active recovery after each game might help reduce soreness and improve performance on subsequent days.
Similarly, if you are training for an event like a marathon and you have a training session the day after a particularly long or intense run, then active recovery might get you better prepared for your next training session.
Conversely, if you have just completed a low-to-moderate intensity bout of exercise, it’s unlikely active recovery will offer the same benefits. And if you will get more than 24 hours of rest between exercise sessions, active recovery is unlikely to do much because this will probably be long enough for your body to recover naturally anyway.
Active recovery may be useful for people with back-to-back sporting commitments. Monkey Business Images/Shutterstock How to get the most out of active recovery
The good news is you don’t have to do a lot of active recovery to see a benefit.
A systematic review looking at the effectiveness of active recovery across 26 studies found 6–10 minutes of exercise was the sweet spot when it came to enhancing recovery.
Interestingly, the intensity of exercise didn’t seem to matter. If it was within this time frame, it had a positive effect.
So it makes sense to make your active recovery easy (because why would you make it hard if you don’t have to?) by keeping it in the light-to-moderate intensity range.
However, don’t expect active recovery to be a complete game changer. The research would suggest the benefits are likely to be small at best.
Hunter Bennett, Lecturer in Exercise Science, University of South Australia and Lewis Ingram, Lecturer in Physiotherapy, University of South Australia
This article is republished from The Conversation under a Creative Commons license. Read the original article.
Share This Post
-
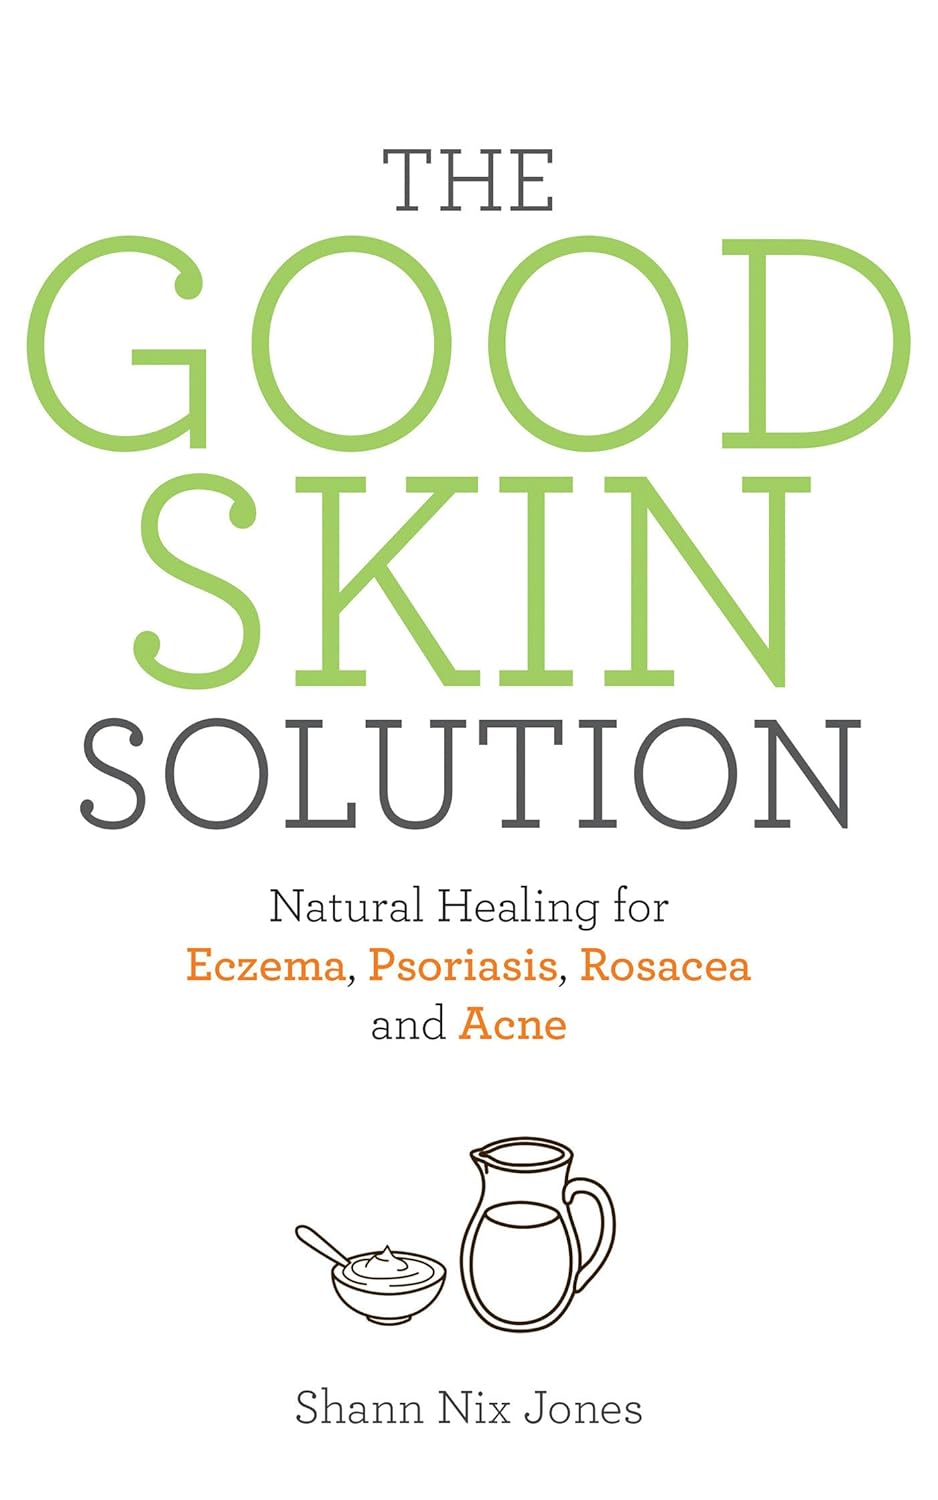
The Good Skin Solution – by Shann Jones
10almonds is reader-supported. We may, at no cost to you, receive a portion of sales if you purchase a product through a link in this article.
Not everyone knows that eczema is not just a skin condition; it’s an autoimmune condition. And thus to heal one’s skin, the gut is a good place to start.
This is not your average gut health book though, because it is focused on optimizing things for one’s skin… Although the author herself learned about this while helping her husband to battle an MRSA infection. In other words, a multi-fronted battle for sure.
The advices in this book are good for, as the subtitle promises, an assortment of other skin conditions too, including psoriasis, rosacea, and acne. She covers the usual bases, and recommends probiotics, of which she’s particularly keen to praise kefir, while advising against the use of antibiotics unless absolutely necessary—something we’ve talked about from time to time at 10almonds, too.
Not content to merely cover those things, she also talks allergies, and walking the fine line between avoiding triggers and developing hypersensitivity by treating to live in a perfectly clean bubble.
Ultimately, she offers “7 daily habits”, 3 of which involve goat’s milk kefir, that’s how keen on it she is. So if you’re vegan, probably this book isn’t as good value, however much it discusses the health woes that can be caused and/or exacerbated by drinking cow’s milk.
The style is very light and personable, which makes for easy reading, more like one friend talking to another, than a scientific textbook.
Bottom line: if you’d like healthier skin, are interested in dietary tweaks and homemade soaps, and have no aversion to goat’s milk and/or kefir, then this book is full of fascinating pointers.
Click here to check out The Good Skin Solution, and who knows, maybe you’ll find it’s the G.O.A.T!
Share This Post
-
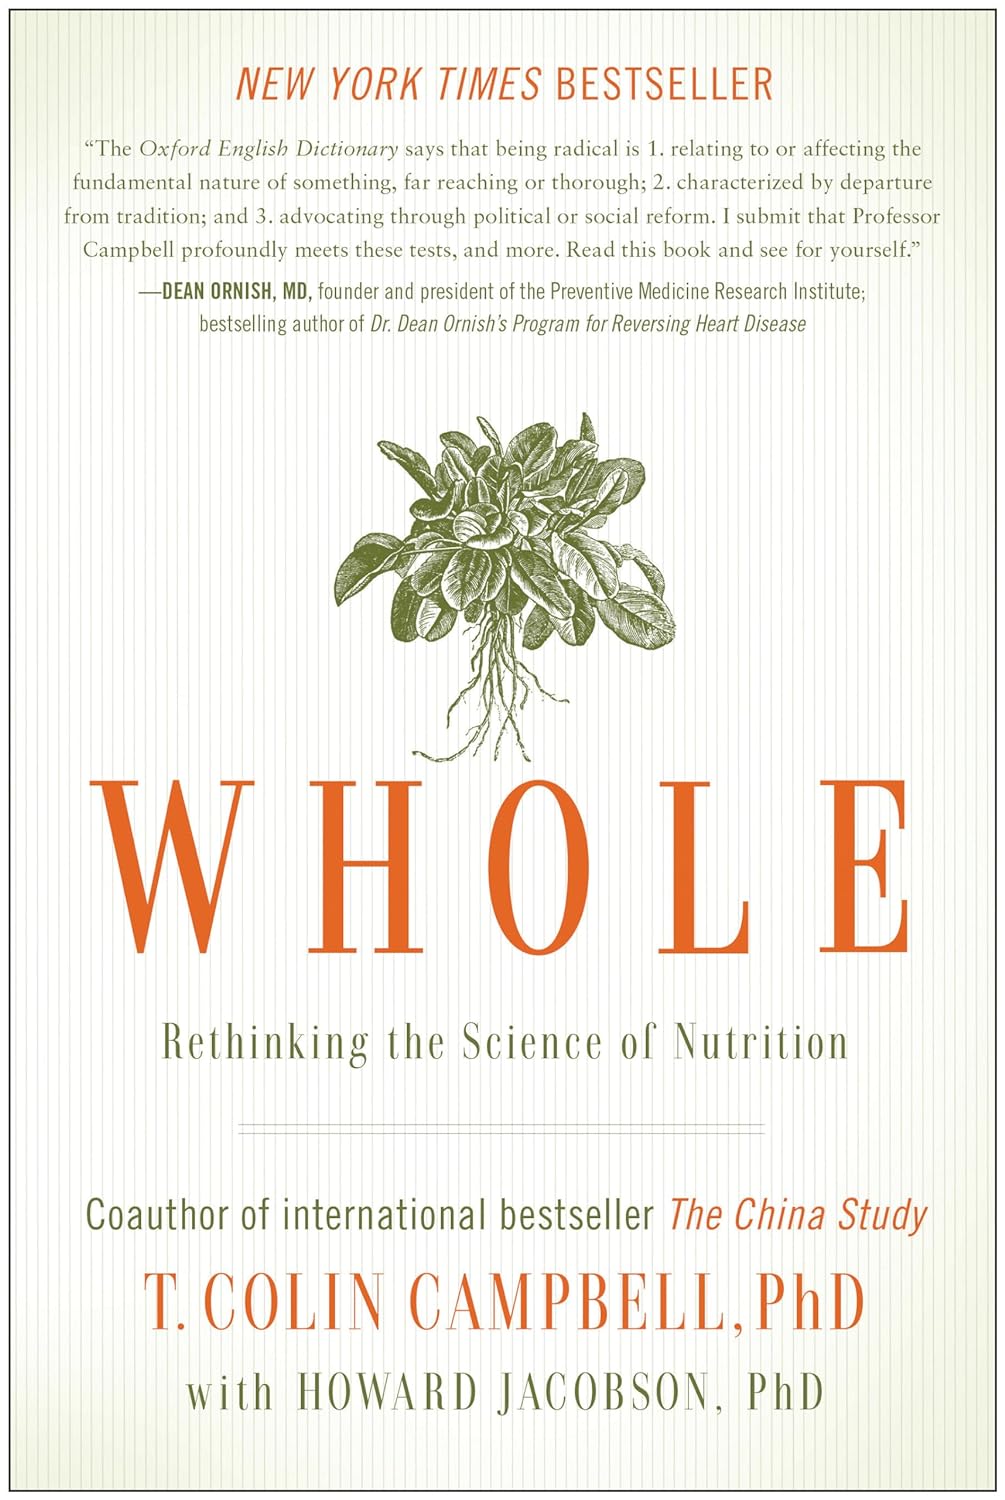
Whole – by Dr. T. Colin Campbell
10almonds is reader-supported. We may, at no cost to you, receive a portion of sales if you purchase a product through a link in this article.
Most of us have at least a broad idea of what we’re supposed to be eating, what nutrients we should be getting. Many of us look at labels, and try to get our daily dose of this and that and the other.
And what we don’t get from food? There are supplements.
Dr. Campbell thinks we can do better:
Perhaps most critical in this book, where it stands out from others (we may already know, for example, that we should try to eat diverse plants and whole foods) is its treatment of why many supplements aren’t helpful.
We tend to hear “supplements are a waste of money” and sometimes they are, sometimes they aren’t. How to know the difference?
Key: things directly made from whole food sources will tend to be better. Seems reasonable, but… why? The answer lies in what else those foods contain. An apple may contain a small amount of vitamin C, less than a vitamin C tablet, but also contains a whole host of other things—tiny phytonutrients, whose machinations are mostly still mysteries to us—that go with that vitamin C and help it work much better. Lab-made supplements won’t have those.
There’s a lot more to the book… A chunk of which is a damning critique of the US healthcare system (the author argues it would be better named a sicknesscare system). We also learn about getting a good balance of macro- and micronutrients from our diet rather than having to supplement so much.
The style is conversational, while not skimping on the science. The author has had more than 150 papers published in peer-reviewed journals, and is no stranger to the relevant academia. Here, however, he focuses on making things easily comprehensible to the lay reader.
In short: if you’ve ever wondered how you’re doing at getting a good nutritional profile, and how you could do better, this is definitely the book for you.
Click here to check out “Whole” on Amazon today, and level up your daily diet!
Share This Post
Related Posts
-
Lettuce vs Arugula – Which is Healthier?
10almonds is reader-supported. We may, at no cost to you, receive a portion of sales if you purchase a product through a link in this article.
Our Verdict
When comparing lettuce to arugula, we picked the arugula.
Why?
These two salad leaves that often fulfil quite similar culinary roles (base of a green salad) are actually of different families, and it shows…
In terms of macros, arugula is lower in carbs, and much higher in protein and fiber—to the point that the protein content in arugula is almost equal to the carb content, which for leaves, is not that common a thing to see.
When it comes to vitamins, things are more even: lettuce has more of vitamins A, B1, B3, B6, and K, while arugula has more of vitamins B5, B9, C, E, and choline. All in all, we can comfortably call it a tie on the vitamin front.
In the category of minerals, things are once again more decided: arugula has more calcium, copper, iron, magnesium, manganese, phosphorus, potassium, and zinc. In contrast, lettuce boasts only more selenium. An easy win for arugula.
Both of these plants have plenty of health-giving phytochemicals, including flavonoids and carotenoids along with other less talked-about things, and while the profiles are quite different for each of them, they stack up about the same in terms of overall benefits in this category.
Taking the various categories into account, this of course adds up to an easy win for arugula, but do enjoy both, especially as lettuce brings benefits that arugula doesn’t in the two categories where they tied!
Want to learn more?
You might like to read:
- How To Avoid Age-Related Macular Degeneration
- Brain Food? The Eyes Have It!
- Spinach vs Kale – Which is Healthier?
Take care!
Don’t Forget…
Did you arrive here from our newsletter? Don’t forget to return to the email to continue learning!
Learn to Age Gracefully
Join the 98k+ American women taking control of their health & aging with our 100% free (and fun!) daily emails:
-
Avocado vs Jackfruit – Which is Healthier?
10almonds is reader-supported. We may, at no cost to you, receive a portion of sales if you purchase a product through a link in this article.
Our Verdict
When comparing avocado to jackfruit, we picked the avocado.
Why?
In terms of macros, avocado is higher in fats (famously healthy ones, including a good dose of omega-3), fiber (nearly 5x more), and protein (despite jackfruit being more often used as a meaty element in recipes, avocado has slightly more). Meanwhile, jackfruit is about 3x higher in carbs. All in all, a clear win for avocado.
Looking at vitamins, avocado has more of vitamins A, B2, B3, B5, B7, B9, E, K, and choline, while jackfruit has more of vitamins B1, B6, and C. Another win for avocado in this category.
In the category of minerals, avocado has more copper, iron, manganese, phosphorus, potassium, selenium, and zinc, while jackfruit has more calcium. One more win for avocado.
Adding up the sections makes for an easy overall win for avocado, but by all means enjoy either or both; diversity is good!
Want to learn more?
You might like:
Jackfruit vs Durian – Which is Healthier? ← including some fun durian facts (such as how to pick a good one, and what happens if you eat durian and drink alcohol)
Enjoy!
Don’t Forget…
Did you arrive here from our newsletter? Don’t forget to return to the email to continue learning!
Learn to Age Gracefully
Join the 98k+ American women taking control of their health & aging with our 100% free (and fun!) daily emails:
-
Walking can prevent low back pain, a new study shows
10almonds is reader-supported. We may, at no cost to you, receive a portion of sales if you purchase a product through a link in this article.
Do you suffer from low back pain that recurs regularly? If you do, you’re not alone. Roughly 70% of people who recover from an episode of low back pain will experience a new episode in the following year.
The recurrent nature of low back pain is a major contributor to the enormous burden low back pain places on individuals and the health-care system.
In our new study, published today in The Lancet, we found that a program combining walking and education can effectively reduce the recurrence of low back pain.
PeopleImages.com – Yuri A/Shutterstock The WalkBack trial
We randomly assigned 701 adults who had recently recovered from an episode of low back pain to receive an individualised walking program and education (intervention), or to a no treatment group (control).
Participants in the intervention group were guided by physiotherapists across six sessions, over a six-month period. In the first, third and fifth sessions, the physiotherapist helped each participant to develop a personalised and progressive walking program that was realistic and tailored to their specific needs and preferences.
The remaining sessions were short check-ins (typically less than 15 minutes) to monitor progress and troubleshoot any potential barriers to engagement with the walking program. Due to the COVID pandemic, most participants received the entire intervention via telehealth, using video consultations and phone calls.
Low back pain can be debilitating. Karolina Kaboompics/Pexels The program was designed to be manageable, with a target of five walks per week of roughly 30 minutes daily by the end of the six-month program. Participants were also encouraged to continue walking independently after the program.
Importantly, the walking program was combined with education provided by the physiotherapists during the six sessions. This education aimed to give people a better understanding of pain, reduce fear associated with exercise and movement, and give people the confidence to self-manage any minor recurrences if they occurred.
People in the control group received no preventative treatment or education. This reflects what typically occurs after people recover from an episode of low back pain and are discharged from care.
What the results showed
We monitored the participants monthly from the time they were enrolled in the study, for up to three years, to collect information about any new recurrences of low back pain they may have experienced. We also asked participants to report on any costs related to their back pain, including time off work and the use of health-care services.
The intervention reduced the risk of a recurrence of low back pain that limited daily activity by 28%, while the recurrence of low back pain leading participants to seek care from a health professional decreased by 43%.
Participants who received the intervention had a longer average period before they had a recurrence, with a median of 208 days pain-free, compared to 112 days in the control group.
In our study, regular walking appeared to help with low back pain. PeopleImages.com – Yuri A/Shutterstock Overall, we also found this intervention to be cost-effective. The biggest savings came from less work absenteeism and less health service use (such as physiotherapy and massage) among the intervention group.
This trial, like all studies, had some limitations to consider. Although we tried to recruit a wide sample, we found that most participants were female, aged between 43 and 66, and were generally well educated. This may limit the extent to which we can generalise our findings.
Also, in this trial, we used physiotherapists who were up-skilled in health coaching. So we don’t know whether the intervention would achieve the same impact if it were to be delivered by other clinicians.
Walking has multiple benefits
We’ve all heard the saying that “prevention is better than a cure” – and it’s true. But this approach has been largely neglected when it comes to low back pain. Almost all previous studies have focused on treating episodes of pain, not preventing future back pain.
A limited number of small studies have shown that exercise and education can help prevent low back pain. However, most of these studies focused on exercises that are not accessible to everyone due to factors such as high cost, complexity, and the need for supervision from health-care or fitness professionals.
On the other hand, walking is a free, accessible way to exercise, including for people in rural and remote areas with limited access to health care.
Walking has a variety of advantages. Cast Of Thousands/Shutterstock Walking also delivers many other health benefits, including better heart health, improved mood and sleep quality, and reduced risk of several chronic diseases.
While walking is not everyone’s favourite form of exercise, the intervention was well-received by most people in our study. Participants reported that the additional general health benefits contributed to their ongoing motivation to continue the walking program independently.
Why is walking helpful for low back pain?
We don’t know exactly why walking is effective for preventing back pain, but possible reasons could include the combination of gentle movements, loading and strengthening of the spinal structures and muscles. It also could be related to relaxation and stress relief, and the release of “feel-good” endorphins, which block pain signals between your body and brain – essentially turning down the dial on pain.
It’s possible that other accessible and low-cost forms of exercise, such as swimming, may also be effective in preventing back pain, but surprisingly, no studies have investigated this.
Preventing low back pain is not easy. But these findings give us hope that we are getting closer to a solution, one step at a time.
Tash Pocovi, Postdoctoral research fellow, Department of Health Sciences, Macquarie University; Christine Lin, Professor, Institute for Musculoskeletal Health, University of Sydney; Mark Hancock, Professor of Physiotherapy, Macquarie University; Petra Graham, Associate Professor, School of Mathematical and Physical Sciences, Macquarie University, and Simon French, Professor of Musculoskeletal Disorders, Macquarie University
This article is republished from The Conversation under a Creative Commons license. Read the original article.
Don’t Forget…
Did you arrive here from our newsletter? Don’t forget to return to the email to continue learning!
Learn to Age Gracefully
Join the 98k+ American women taking control of their health & aging with our 100% free (and fun!) daily emails:

