
Accidental falls in the older adult population: What academic research shows
10almonds is reader-supported. We may, at no cost to you, receive a portion of sales if you purchase a product through a link in this article.
Accidental falls are among the leading causes of injury and death among adults 65 years and older worldwide. As the aging population grows, researchers expect to see an increase in the number of fall injuries and related health spending.
Falls aren’t unique to older adults. Nealy 684,000 people die from falls each year globally. Another 37.3 million people each year require medical attention after a fall, according to the World Health Organization. But adults 65 and older account for the greatest number of falls.
In the United States, more than 1 in 4 older adults fall each year, according to the National Institute on Aging. One in 10 report a fall injury. And the risk of falling increases with age.
In 2022, health care spending for nonfatal falls among older adults was $80 billion, according to a 2024 study published in the journal Injury Prevention.
Meanwhile, the fall death rate in this population increased by 41% between 2012 and 2021, according to the latest CDC data.
“Unfortunately, fall-related deaths are increasing and we’re not sure why that is,” says Dr. Jennifer L. Vincenzo, an associate professor at the University of Arkansas for Medical Sciences in the department of physical therapy and the Center for Implementation Research. “So, we’re trying to work more on prevention.”
Vincenzo advises journalists to write about how accidental falls can be prevented. Remind your audiences that accidental falls are not an inevitable consequence of aging, and that while we do decline in many areas with age, there are things we can do to minimize the risk of falls, she says. And expand your coverage beyond the national Falls Prevention Awareness Week, which is always during the first week of fall — Sept. 23 to 27 this year.
Below, we explore falls among older people from different angles, including injury costs, prevention strategies and various disparities. We have paired each angle with data and research studies to inform your reporting.
Falls in older adults
In 2020, 14 million older adults in the U.S. reported falling during the previous year. In 2021, more than 38,700 older adults died due to unintentional falls, according to the CDC.
A fall could be immediately fatal for an older adult, but many times it’s the complications from a fall that lead to death.
The majority of hip fractures in older adults are caused by falls, Vincenzo says, and “it could be that people aren’t able to recover [from the injury], losing function, maybe getting pneumonia because they’re not moving around, or getting pressure injuries,” she says.
In addition, “sometimes people restrict their movement and activities after a fall, which they think is protective, but leads to further functional declines and increases in fall risk,” she adds.
Factors that can cause a fall include:
- Poor eyesight, reflexes and hearing. “If you cannot hear as well, anytime you’re doing something in your environment and there’s a noise, it will be really hard for you to focus on hearing what that noise is and what it means and also moving at the same time,” Vincenzo says.
- Loss of strength, balance, and mobility with age, which can lessen one’s ability to prevent a fall when slipping or tripping.
- Fear of falling, which usually indicates decreased balance.
- Conditions such as diabetes, heart disease, or problems with nerves or feet that can affect balance.
- Conditions like incontinence that cause rushed movement to the bathroom.
- Cognitive impairment or certain types of dementia.
- Unsafe footwear such as backless shoes or high heels.
- Medications or medication interactions that can cause dizziness or confusion.
- Safety hazards in the home or outdoors, such as poor lighting, steps and slippery surfaces.
Related Research
Nonfatal and Fatal Falls Among Adults Aged ≥65 Years — United States, 2020–2021
Ramakrishna Kakara, Gwen Bergen, Elizabeth Burns and Mark Stevens. Morbidity and Mortality Weekly Report, September 2023.
Summary: Researchers analyzed data from the 2020 Behavioral Risk Factor Surveillance System — a landline and mobile phone survey conducted each year in all 50 U.S. states and the District of Columbia — and data from the 2021 National Vital Statistics System to identify patterns of injury and death due to falls in the U.S. by sex and state for adults 65 years and older. Among the findings:
- The percentage of women who reported falling was 28.9%, compared with 26.1% of men.
- Death rates from falls were higher among white and American Indian or Alaska Native older adults than among older adults from other racial and ethnic groups.
- In 2020, the percentage of older adults who reported falling during the past year ranged from 19.9% in Illinois to 38.0% in Alaska. The national estimate for 18 states was 27.6%.
- In 2021, the unintentional fall-related death rate among older adults ranged from 30.7 per 100,000 older adults in Alabama to 176.5 in Wisconsin. The national estimate for 26 states was 78.
“Although common, falls among older adults are preventable,” the authors write. “Health care providers can talk with patients about their fall risk and how falls can be prevented.”
Trends in Nonfatal Falls and Fall-Related Injuries Among Adults Aged ≥65 Years — United States, 2012-2018
Briana Moreland, Ramakrishna Kakara and Ankita Henry. Morbidity and Mortality Weekly Report, July 2020.
Summary: Researchers compared data from the 2018 Behavioral Risk Factor Surveillance System. Among the findings:
- The percentage of older adults reporting a fall increased from 2012 to 2016, then slightly decreased from 2016 to 2018.
- Even with this decrease in 2018, older adults reported 35.6 million falls. Among those falls, 8.4 million resulted in an injury that limited regular activities for at least one day or resulted in a medical visit.
“Despite no significant changes in the rate of fall-related injuries from 2012 to 2018, the number of fall-related injuries and health care costs can be expected to increase as the proportion of older adults in the United States grows,” the authors write.
Understanding Modifiable and Unmodifiable Older Adult Fall Risk Factors to Create Effective Prevention Strategies
Gwen Bergen, et al. American Journal of Lifestyle Medicine, October 2019.
Summary: Researchers used data from the 2016 U.S. Behavioral Risk Factor Surveillance System to better understand the association between falls and fall injuries in older adults and factors such as health, state and demographic characteristics. Among the findings:
- Depression had the strongest association with falls and fall injuries. About 40% of older adults who reported depression also reported at least one fall; 15% reported at least one fall injury.
- Falls and depression have several factors in common, including cognitive impairment, slow walking speed, poor balance, slow reaction time, weakness, low energy and low levels of activity.
- Other factors associated with an increased risk of falling include diabetes, vision problems and arthritis.
“The multiple characteristics associated with falls suggest that a comprehensive approach to reducing fall risk, which includes screening and assessing older adult patients to determine their unique, modifiable risk factors and then prescribing tailored care plans that include evidence-based interventions, is needed,” the authors write.
Health care use and cost
In addition to being the leading cause of injury, falls are the leading cause of hospitalization in older adults. Each year, about 3 million older adults visit the emergency department due to falls. More than 1 million get hospitalized.
In 2021, falls led to more than 38,000 deaths in adults 65 and older, according to the CDC.
The annual financial medical toll of falls among adults 65 years and older is expected to be more than $101 billion by 2030, according to the National Council on Aging, an organization advocating for older Americans.
Related research
Healthcare Spending for Non-Fatal Falls Among Older Adults, USA
Yara K. Haddad, et al. Injury Prevention, July 2024.
Summary: In 2015, health care spending related to falls among older adults was roughly $50 billion. This study aims to update the estimate, using the 2017, 2019 and 2021 Medicare Current Beneficiary Survey, the most comprehensive and complete survey available on the Medicare population. Among the findings:
- In 2020, health care spending for non-fatal falls among older adults was $80 billion.
- Medicare paid $53.3 billion of the $80 billion, followed by $23.2 billion paid by private insurance or patients and $3.5 billion by Medicaid.
“The burden of falls on healthcare systems and healthcare spending will continue to rise if the risk of falls among the aging population is not properly addressed,” the authors write. “Many older adult falls can be prevented by addressing modifiable fall risk factors, including health and functional characteristics.”
Cost of Emergency Department and Inpatient Visits for Fall Injuries in Older Adults Lisa Reider, et al. Injury, February 2024.
Summary: The researchers analyzed data from the 2016-2018 National Inpatient Sample and National Emergency Department Sample, which are large, publicly available patient databases in the U.S. that include all insurance payers such as Medicare and private insurance. Among the findings:
- During 2016-2018, more than 920,000 older adults were admitted to the hospital and 2.3 million visited the emergency department due to falls. The combined annual cost was $19.2 billion.
- More than half of hospital admissions were due to bone fractures. About 14% of these admissions were due to multiple fractures and cost $2.5 billion.
“The $20 billion in annual acute treatment costs attributed to fall injury indicate an urgent need to implement evidence-based fall prevention interventions and underscores the importance of newly launched [emergency department]-based fall prevention efforts and investments in geriatric emergency departments,” the authors write.
Hip Fracture-Related Emergency Department Visits, Hospitalizations and Deaths by Mechanism of Injury Among Adults Aged 65 and Older, United States 2019
Briana L. Moreland, Jaswinder K. Legha, Karen E. Thomas and Elizabeth R. Burns. Journal of Aging and Health, June 2024.
Summary: The researchers calculated hip fracture-related U.S. emergency department visits, hospitalizations and deaths among older adults, using data from the Healthcare Cost and Utilization Project and the National Vital Statistics System. Among the findings:
- In 2019, there were 318,797 emergency department visits, 290,130 hospitalizations and 7,731 deaths related to hip fractures among older adults.
- Nearly 88% of emergency department visits and hospitalizations and 83% of deaths related to hip fractures were caused by falls.
- These rates were highest among those living in rural areas and among adults 85 and older. More specifically, among adults 85 and older, the rate of hip fracture-related emergency department visits was nine times higher than among adults between 65 and 74 years old.
“Falls are common among older adults, but many are preventable,” the authors write. “Primary care providers can prevent falls among their older patients by screening for fall risk annually or after a fall, assessing modifiable risk factors such as strength and balance issues, and offering evidence-based interventions to reduce older adults’ risk of falls.”
Fall prevention
Several factors, including exercising, managing medication, checking vision and making homes safer can help prevent falls among older adults.
“Exercise is one of the best interventions we know of to prevent falls,” Vincenzo says. But “walking in and of itself will not help people to prevent falls and may even increase their risk of falling if they are at high risk of falls.”
The National Council on Aging also has a list of evidence-based fall prevention programs, including activities and exercises that are shown to be effective.
The National Institute on Aging has a room-by-room guide on preventing falls at home. Some examples include installing grab bars near toilets and on the inside and outside of the tub and shower, sitting down while preparing food to prevent fatigue, and keeping electrical cords near walls and away from walking paths.
There are also national and international initiatives to help prevent falls.
Stopping Elderly Accidents, Deaths and Injuries, or STEADI, is an initiative by the CDC’s Injury Center to help health care providers who treat older adults. It helps providers screen patients for fall risk, assess their fall risk factors and reduce their risk by using strategies that research has shown to be effective. STEADI’s guidelines are in line with the American and British Geriatric Societies’ Clinical Practice Guidelines for fall prevention.
“We’re making some iterations right now to STEADI that will come out in the next couple of years based on the World Falls Guidelines, as well as based on clinical providers’ feedback on how to make [STEADI] more feasible,” Vincenzo says.
The World Falls Guidelines is an international initiative to prevent falls in older adults. The guidelines are the result of the work of 14 international experts who came together in 2019 to consider whether new guidelines on fall prevention were needed. The task force then brought together 96 experts from 39 countries across five continents to create the guidelines.
The CDC’s STEADI initiative has a screening questionnaire for consumers to check their risk of falls, as does the National Council on Aging.
On the policy side, U.S. Rep. Carol Miller, R-W.V., and Melanie Stansbury, D-N.M., introduced the Stopping Addiction and Falls for the Elderly (SAFE) Act in March 2024. The bill would allow occupational and physical therapists to assess fall risks in older adults as part of the Medicare Annual Wellness Benefit. The bill was sent to the House Subcommittee on Health in the same month.
Meanwhile, older adults’ attitudes toward falls and fall prevention are also pivotal. For many, coming to terms with being at risk of falls and making changes such as using a cane, installing railings at home or changing medications isn’t easy for all older adults, studies show.
“Fall is a four-letter F-word in a way to older adults,” says Vincenzo, who started her career as a physical therapist. “It makes them feel ‘old.’ So, it’s a challenge on multiple fronts: U.S. health care infrastructure, clinical and community resources and facilitating health behavior change.”
Related research
Environmental Interventions for Preventing Falls in Older People Living in the Community
Lindy Clemson, et al. Cochrane Database of Systematic Reviews, March 2023.
Summary: This review includes 22 studies from 10 countries involving a total of 8,463 older adults who live in the community, which includes their own home, a retirement facility or an assisted living facility, but not a hospital or nursing home. Among the findings:
- Removing fall hazards at home reduced the number of falls by 38% among older adults at a high risk of having a fall, including those who have had a fall in the past year, have been hospitalized or need support with daily activities. Examples of fall hazards at home include a stairway without railings, a slippery pathway or poor lighting.
- It’s unclear whether checking prescriptions for eyeglasses, wearing special footwear or installing bed alarm systems reduces the rate of falls.
- It’s also not clear whether educating older adults about fall risks reduces their fall risk.
The Influence of Older Adults’ Beliefs and Attitudes on Adopting Fall Prevention Behaviors
Judy A. Stevens, David A. Sleet and Laurence Z. Rubenstein. American Journal of Lifestyle Medicine. January 2017.
Summary: Persuading older adults to adopt interventions that reduce their fall risk is challenging. Their attitudes and beliefs about falls play a large role in how well they accept and adopt fall prevention strategies, the authors write. Among the common attitudes and beliefs:
- Many older adults believe that falls “just happen,” are a normal result of aging or are simply due to bad luck.
- Many don’t acknowledge or recognize their fall risk.
- For many, falls are considered to be relevant only for frail or very old people.
- Many believe that their home environment or daily activities can be a risk for fall, but do not consider biological factors such as dizziness or muscle weakness.
- For many, fall prevention simply consists of “being careful” or holding on to things when moving about the house.
“To reduce falls, health care practitioners have to help patients understand and acknowledge their fall risk while emphasizing the positive benefits of fall prevention,” the authors write. “They should offer patients individualized fall prevention interventions as well as provide ongoing support to help patients adopt and maintain fall prevention strategies and behaviors to reduce their fall risk. Implementing prevention programs such as CDC’s STEADI can help providers discuss the importance of falls and fall prevention with their older patients.”
Reframing Fall Prevention and Risk Management as a Chronic Condition Through the Lens of the Expanded Chronic Care Model: Will Integrating Clinical Care and Public Health Improve Outcomes?
Jennifer L. Vincenzo, Gwen Bergen, Colleen M. Casey and Elizabeth Eckstrom. The Gerontologist, June 2024.
Summary: The authors recommend approaching fall prevention from the lens of chronic disease management programs because falls and fall risk are chronic issues for many older adults.
“Policymakers, health systems, and community partners can consider aligning fall risk management with the [Expanded Chronic Care Model], as has been done for diabetes,” the authors write. “This can help translate high-quality research on the effectiveness of fall prevention interventions into daily practice for older adults to alter the trajectory of older adult falls and fall-related injuries.”
Disparities
Older adults face several barriers to reducing their fall risk. Accessing health care services and paying for services such as physical therapy is not feasible for everyone. Some may lack transportation resources to go to and from medical appointments. Social isolation can increase the risk of death from falls. In addition, physicians may not have the time to fit in a fall risk screening while treating older patients for other health concerns.
Moreover, implementing fall risk screening, assessment and intervention in the current U.S. health care structure remains a challenge, Vincenzo says.
Related research
Mortality Due to Falls by County, Age Group, Race, and Ethnicity in the USA, 2000-19: A Systematic Analysis of Health Disparities
Parkes Kendrick, et al. The Lancet Public Health, August 2024.
Summary: Researchers analyzed death registration data from the U.S. National Vital Statistics System and population data from the U.S. National Center for Health Statistics to estimate annual fall-related mortality. The data spanned from 2000 to 2019 and includes all age groups. Among the findings:
- The disparities between racial and ethnic populations varied widely by age group. Deaths from falls among younger adults were highest for the American Indian/Alaska Native population, while among older adults it was highest for the white population.
- For older adults, deaths from falls were particularly high in the white population within clusters of counties across states including Florida, Minnesota and Wisconsin.
- One factor that could contribute to higher death rates among white older adults is social isolation, the authors write. “Studies suggest that older Black and Latino adults are more likely to have close social support compared with older white adults, while AIAN and Asian individuals might be more likely to live in multigenerational households,” they write.
“Among older adults, current prevention techniques might need to be restructured to reduce frailty by implementing early prevention and emphasizing particularly successful interventions. Improving social isolation and evaluating the effectiveness of prevention programs among minoritized populations are also key,” the authors write.
Demographic Comparisons of Self-Reported Fall Risk Factors Among Older Adults Attending Outpatient Rehabilitation
Mariana Wingood, et al. Clinical Interventions in Aging, February 2024.
Summary: Researchers analyzed the electronic health record data of 108,751 older adults attending outpatient rehabilitation within a large U.S. health care system across seven states, between 2018 and 2022. Among the findings:
- More than 44% of the older adults were at risk of falls; nearly 35% had a history of falls.
- The most common risk factors for falls were diminished strength, gait and balance.
- Compared to white older adults, Native American/Alaska Natives had the highest prevalence of fall history (43.8%) and Hispanics had the highest prevalence of falls with injury (56.1%).
“Findings indicate that rehabilitation providers should perform screenings for these impairments, including incontinence and medication among females, loss of feeling in the feet among males, and all Stay Independent Questionnaire-related fall risk factors among Native American/Alaska Natives, Hispanics, and Blacks,” the authors write.
Resources and articles
- National Institute on Aging
- National Council on Aging
- Gerontological Society of America
- Home Health Agencies Failed To Report Over Half of Falls With Major Injury and Hospitalization Among Their Medicare Patients, a 2023 report from the U.S Department of Health and Human Services’ Office of Inspector General.
- 6 tips for improving new coverage of older people, a tip sheet from The Journalist’s Resource.
- Crosswalk and pedestrian safety: What you need to know from recent research, from The Journalist’s Resource.
- Aging-in-place technology challenges and trends, a resource from the Association of Health Care Journalists.
- Successful aging at home: what reporters should know, a resource from the Association of Health Care Journalists.
This article first appeared on The Journalist’s Resource and is republished here under a Creative Commons license.
Don’t Forget…
Did you arrive here from our newsletter? Don’t forget to return to the email to continue learning!

Learn to Age Gracefully
Join the 98k+ American women taking control of their health & aging with our 100% free (and fun!) daily emails:
-

14 Powerful Strategies To Prevent Dementia

10almonds is reader-supported. We may, at no cost to you, receive a portion of sales if you purchase a product through a link in this article.
Dementia risk starts climbing very steeply after the age of 65, but it’s not entirely predetermined. Dr. Brad Stanfield, a primary care physician, has insights:
The strategies
We’ll not keep them a mystery; they are:
- Cognitive stimulation: which means genuinely challenging mental activities using a variety of mental faculties. This will usually mean that anything that is just “same old, same old” all the time will stop giving benefits after a short while once it becomes rote, and you’ll need something harder and/or different.
- Hearing health: being unable to participate in conversations increases dementia risk; hearing aids can help.
- Eyesight health: similar to the above; regular eye tests are good, and the use of glasses where appropriate.
- Depression management: midlife depression is linked to later life dementia, likely in large part due to social isolation and a lack of stimulation, but either way, treating depression earlier reduces later dementia risk.
- Exercising regularly: what’s good for the heart is good for the brain; the brain is a hungry organ and the blood is what feeds it (and removes things that shouldn’t be there)
- Head injury avoidance: even mild head injuries can cause problems down the road. Protecting one’s head in sports, and even while casually cycling, is important.
- Smoking cessation: just don’t smoke; if you smoke, make it a top priority to quit unless you are given direct strong medical advice to the contrary (there are cases, few and far between, whereby quitting smoking genuinely needs to be deferred until after something else is dealt with first, but they are a lot rarer than a lot of people who are simply afraid of quitting would like to believe)
- Cholesterol management: again, healthy blood means a healthy brain, and that goes for triglycerides too.
- Weight management: obesity, especially waist to hip ratio (indicating visceral abdominal fat specifically) is associated with many woes, including dementia.
- Diabetes management: once again, healthy blood means a healthy brain, and that goes for blood sugar management too.
- Blood pressure management: guess what, healthy blood still means a healthy brain, and that goes for blood pressure too.
- Alcohol reduction/cessation: alcohol is bad for pretty much everything, and for most people who drink, quitting is probably the top thing to do after quitting smoking.
- Social engagement: while we all may have our different preferences on a scale of introversion to extroversion, we are fundamentally a social species and thrive best with social contact, even if it’s just a few people.
- Air pollution reduction: avoiding pollutants, and filtering the air we breathe where pollutants are otherwise unavoidable, makes a measurable difference to brain health outcomes.
For more information on all of these (except the last two, which really he only mentions in passing), enjoy:
Click Here If The Embedded Video Doesn’t Load Automatically!
Want to learn more?
You might also like to read:
How To Reduce Your Alzheimer’s Risk ← our own main feature on the topic
Take care!
Share This Post
-
Peach vs Passion Fruit – Which is Healthier?
10almonds is reader-supported. We may, at no cost to you, receive a portion of sales if you purchase a product through a link in this article.
Our Verdict
When comparing peach to passion fruit, we picked the passion fruit.
Why?
It wasn’t close!
In terms of macros, passion fruit has more than 2x the protein, 2x the carbs, and 7x the fiber. That’s a big difference!
In the category of vitamins, peach has more of vitamins B1, B5, E, and K, while passion fruit has more of vitamins A, B2, B3, B6, B7, B9, C, and choline. Again, not close.
When it comes to minerals, peach has more manganese and zinc, while passion fruit has more calcium, copper, iron, magnesium, phosphorus, potassium, and selenium—and most of those margins are “by multiples”, not just a fraction more. Again, a clear winner here.
Adding up these three overwhelming wins for passion fruit makes for an obvious total win for passion fruit.
As ever, enjoy both, but if you’re going to pick one, then one of these fruits is extra passionate about bringing you nutrients.
Want to learn more?
You might like to read:
Top 8 Fruits That Prevent & Kill Cancer ← peaches are on this list!
Take care!
Share This Post
-

16/8 Intermittent Fasting For Beginners
10almonds is reader-supported. We may, at no cost to you, receive a portion of sales if you purchase a product through a link in this article.
Health Insider explains in super-simple fashion why and how to do Intermittent Fasting (IF), which is something that can sound complicated at first, but becomes very simple and easy once understood.
What do we need to know?
Intermittent fasting (IF) is a good, well-evidenced way to ease your body’s metabolic load, and
give your organs a chance to recover from the strain of digestion and its effects. That’s not just your gastrointestinal organs! It’s your pancreas and liver too, amongst others—this is about glucose metabolism as much as it is about digestion.This, in turn, allows your body some downtime to do its favorite thing, which is: maintenance!
This maintenance takes the form of enhanced cellular apoptosis and autophagy, helping to keep cells young and cancer-free.
In other words, with well-practised intermittent fasting, we can reduce our risk of metabolic disease (including heart disease and diabetes) as well as cancer and neurodegeneration.
You may be wondering: this sounds miraculous; what’s the catch? There are a couple:
- While fasting from food, the body’s enhanced metabolism requires more water, so you’ll need to take extra care keep on top of your hydration (this is one reason why Ramadan fasting, while healthy for most people, is not as healthy as IF—because Ramadan fasting means abstaining from water, too).
- If you are diabetic, and especially if you have Type 1 Diabetes, fasting may not be a safe option for you, since if you get a hypo in the middle of your fasting period, it’s obviously not a good idea to wait another many hours before fixing it.
Extra note on that last one: it’s easy to think “can’t I just lower my bolus insulin instead of eating?” and while superficially yes that will raise your blood sugar levels, it’s because the sugar will be sticking around in your blood, and not actually getting released into the organs that need it. So while your blood glucose monitor may say you’re fine, you will be starving your organs and if you keep it up they may suffer serious damage.
Disclaimer: our standard legal/medical disclaimer applies, and this is intended for educational purposes only; please do speak with your endocrinologist before changing anything you usually do with regard to your blood sugar maintenance.
Ok, back onto the cheerier topic at hand:
Aside from the above: for most people, IF is a remarkably healthful practice in very many ways.
For more on the science, practicalities, and things to do/avoid, enjoy this short (4:53) video:
Click Here If The Embedded Video Doesn’t Load Automatically
Want to know more?
Check out our previous main feature on this topic:
Intermittent Fasting: Mythbusting Edition
Enjoy!
Share This Post

Related Posts
-

Healthy Heart, Healthy Brain – by Dr. Bradley Bale & Dr. Amy Doneen
10almonds is reader-supported. We may, at no cost to you, receive a portion of sales if you purchase a product through a link in this article.
We’ve often written that “what’s good for your heart is good for your brain”, because the former feeds the latter and takes away detritus. You cannot have a healthy brain without a healthy heart.
This book goes into that in more detail than we have ever had room to here! This follows from their previous book “Beat The Heart Attack Gene”, but we’re jumping in here because that book doesn’t really contain anything not also included in this one.
The idea is the same though: it is the authors’ opinion that far too many interventions are occurring far too late, and they want to “wake everyone up” (including their colleagues in the field) to encourage earlier (and broader!) testing.
Fun fact: that also reminded this reviewer that she had a pending invitation for blood tests to check these kinds of things—phlebotomy appointment now booked, yay!
True the spirit of such exhortation to early testing, this book does include diagnostic questionnaires, to help the reader know where we might be at. And, interestingly, while the in-book questionnaire format of “so many points for this answer, so many for that one”, etc is quite normal, what they do differently in the diagnostics is that in cases of having to answer “I don’t know”, it assigns the highest-risk point value, i.e. the test will err on the side of assume the worst, in the case of a reader not knowing, for example, what our triglycerides are like. Which, when one thinks about it, is probably a very sensible reasoning.
There’s a lot of advice about specific clinical diagnostic tools and things to ask for, and also things that may raise an alarm that most people might overlook (including doctors, especially if they are only looking for something else at the time).
You may be wondering: do they actually give advice on what to actually do to improve heart and brain health, or just how to be aware of potential problems? And the answer is that the latter is a route to the former, and yes they do offer comprehensive advice—well beyond “eat fiber and get some exercise”, and even down to the pros and cons of various supplements and medications. When it comes to treating a problem that has been identified, or warding off a risk that has been flagged, the advice is a personalized, tailored, approach. Obviously there’s a limit to how much they can do that in the book, but even so, we see a lot of “if this then that” pointers to optimize things along the way.
The style is… a little salesy for this reviewer’s tastes. That is to say, while it has a lot of information of serious value, it’s also quite padded with self-congratulatory anecdotes about the many occasions the authors have pulled a Dr. House and saved the day when everyone else was mystified or thought nothing was wrong, the wonders of their trademarked methodology, and a lot of hype for their own book, as in, the book that’s already in your hands. Without all this padding, the book could have been cut by perhaps a third, if not more. Still, none of that takes away from the valuable insights that are in the book too.
Bottom line: if you’d like to have a healthier heart and brain, and especially if you’d like to avoid diseases of those two rather important organs, then this book is a treasure trove of information.
Click here to check out Healthy Heart, Healthy Brain, and secure your good health now, for later!
Don’t Forget…
Did you arrive here from our newsletter? Don’t forget to return to the email to continue learning!
Learn to Age Gracefully
Join the 98k+ American women taking control of their health & aging with our 100% free (and fun!) daily emails:
-
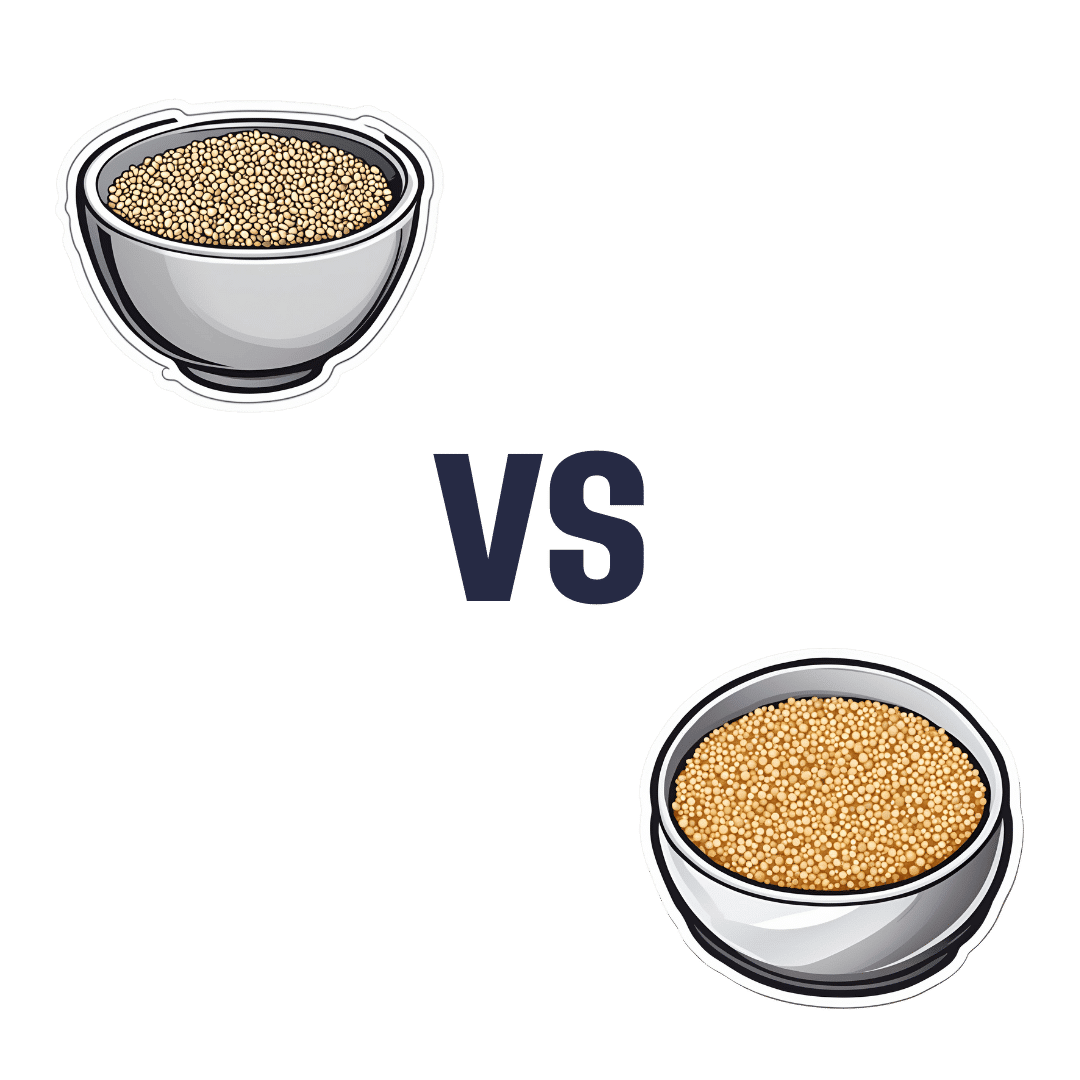
Millet vs Couscous – Which is Healthier?
10almonds is reader-supported. We may, at no cost to you, receive a portion of sales if you purchase a product through a link in this article.
Our Verdict
When comparing millet to couscous, we picked the millet.
Why?
In terms of macros, they’re pretty much equal, and are both moderately high glycemic index foods so to abate that, it’s good to have them with some fibrous foods (e.g. some vegetables) and fats (e.g. perhaps sauté the vegetables with a little olive oil), to slow down the carbs a little. But, as there’s nothing meaningful between them in this regard, we declare this category a tie.
In the category of vitamins, millet has more of vitamins B1, B2, B3, B6, B7, B9, K, and choline, while millet has more of vitmains B5 and E. An easy win for millet here.
When it comes to minerals, it’s a similar story: millet has more copper, iron, magnesium, manganese, phosphorus, potassium, and zinc, while couscous has more calcium and selenium. Another clear win for millet.
For those avoiding gluten, you want to be aware that millet is naturally gluten-free, while couscous is usually made of durum wheat and thus contains gluten.
For those avoiding oxalates (shouldn’t make any difference for most people, but if you have certain kidney problems, then it can matter), millet is low in oxalates and couscous is high in oxalates.
All in all, it’s a clear overall win for millet!
Want to learn more?
You might like to read:
Grains: Bread Of Life, Or Cereal Killer?
Enjoy!
Don’t Forget…
Did you arrive here from our newsletter? Don’t forget to return to the email to continue learning!
Learn to Age Gracefully
Join the 98k+ American women taking control of their health & aging with our 100% free (and fun!) daily emails:
-
Beetroot For More Than Just Your Blood Pressure
10almonds is reader-supported. We may, at no cost to you, receive a portion of sales if you purchase a product through a link in this article.
Beetroot is well-known for being good for blood pressure, but what else can it do?
Firstly, blood pressure, yes
This is because… Well, we’ll quote from a paper:
❝As a source of nitrate, beetroot ingestion provides a natural means of increasing in vivo nitric oxide (NO) availability and has emerged as a potential strategy to prevent and manage pathologies associated with diminished NO bioavailability, notably hypertension and endothelial function❞
Source: The Potential Benefits of Red Beetroot Supplementation in Health and Disease
That’s a little modest in its wording though, so let’s just be clear, it does work:
- The effects of dietary nitrate on blood pressure and endothelial function: a review of human intervention studies
- Clinical evidence demonstrating the utility of inorganic nitrate in cardiovascular health
- Vascular effects of dietary nitrate (as found in green leafy vegetables and beetroot) via the nitrate-nitrite-nitric oxide pathway
…where you can see that it significantly reduced systolic and diastolic blood pressure.
Note: this does mean that if you suffer conversely from hypotension (dangerously low blood pressure) you should probably skip the beetroot.
For your blood sugar levels, too
The fiber in whole beetroot or powdered beetroot extract (but not beetroot juice) is, as usual, good for balancing blood sugars. However, in the case of beetroot, it (probably because of the betalain content, specifically betanin) also improves insulin sensitivity, resulting in lower fasting and postprandial (after-dinner) insulin levels:
See also (cited in the above paper): Post-prandial effect of beetroot (beta vulgaris) juice on glucose and lipids levels of apparently healthy subjects
For your blood lipids, also
This one has less readily available research to support it, so in the category of “papers that aren’t paywalled into oblivion”, here’s one that concludes with the entertainingly specific:
❝Results: Beetroot juice intake increased plasma high density lipoprotein (t= -60.88, P<0.05). Triglyceride, total cholesterol, and low density lipoprotein were reduced (P<0.05). Compared with placebo, beetroot juice reduced the concentrations of triglyceride, total cholesterol, and low density lipoprotein (P<0.05).
Conclusion: Regular beetroot juice intake has significant effects on lipid profile in female soccer players, hence its suggestion for preventing diseases such as hypercholesterolemia and hypertension in female soccer players.❞
However, even if you are not a female soccer player, chances are it will have the same effect on your physiology as theirs (but, credit where it’s due, it’s right that they make claims about only what they know for sure).
Here’s the paper: Efficacy of Beetroot Juice Consumption on the Lipid Profile of Female Soccer Players
What’s good for your blood, is good for your brain
…and that’s just as true here:
When reading that, you’ll see that as well as two health outcome benefits (antidiabetic and anti-Alzheimer’s), there are also two mechanisms of action, which are:
- The blood sugar lowering, insulin sensitivity increasing, lipid improving, qualities we discussed already
- Its fabulous flavonoid content
These two things each in turn have a lot of other components and nuances, so here’s an infographic covering them ← this flowchart makes it all a lot clearer
On which note, those flavonoids aren’t the only active compounds present that result in…
Antioxidant & anti-inflammatory action
This one’s pretty straightforward, but it’s worth mentioning also that (as is commonly the case) what fights oxidation also fights cancer:
❝In recent years, the beetroot, especially the betalains (betanin) and nitrates it contains, now has received increasing attention for their effective biological activity.
Betalains have been proven to eliminate oxidative and nitrative stress by scavenging DPPH, preventing DNA damage, and reducing LDL.
It also has been found to exert antitumor activity by inhibiting cell proliferation, angiogenesis, inducing cell apoptosis, and autophagy.❞
Want to try some?
We don’t sell it, but you can easily grow your own or find it at your local supermarket; if you prefer it in supplement form, dried is better than juice (for a multitude of reasons), so here for your convenience is an example product on Amazon 😎
Enjoy!
Don’t Forget…
Did you arrive here from our newsletter? Don’t forget to return to the email to continue learning!
Learn to Age Gracefully
Join the 98k+ American women taking control of their health & aging with our 100% free (and fun!) daily emails: